A Study of factors influencing quality of work life of employees of art metal ware handicraft sector of India
Vaishali Dhingra,
Head, Department of Management Studies, TMU
Research Scholar,
Teerthanker Mahaveer University
Prof Ajay K Garg
Fairleigh Dickinson University
Vancouver, Canada
Abstract
“Whenever failure comes, if we analyse it critically, in 99% of cases, we shall find that it was because we did not pay attention to the means. Proper attention to the finishing, strengthening of means is what we need. With the means alright, the end must come.”[1]
-Swami Vivekananda
The above saying forms the basis of this study. It implies that if the means adopted for any purpose are correct, the end result is bound to be good. Thus, if the QWL measures adopted by any work organization are appropriate and are implemented in true spirit, employees’ perception towards that organization is likely to be positive. There are several factors which influence the quality of work life of employees. These factors may be related to work life or even personal life of the employees but nonetheless they have a bearing upon the organizational performance.
Key Words
Quality of work life, art metal ware, handicraft sector
Quality of Work Life: Walton (1975) proposed eight major conceptual categories relating to Quality of Work Life as (1) adequate and fair compensation, (2) safe and healthy working conditions, (3) immediate opportunity to use and develop human capacities, (4) opportunity for continued growth and security, (5) social integration in the work organization, (6) constitutionalism in the work organization, (7) work and total life space and (8) social relevance of work life.
In a sequel of papers in Vikalpa, Prof.Chakraborthy S.K. (1987) defined Quality of Work Life (QWL) as a process of work organizations which enables its members at all levels to participate in shaping the organisations’ environment, methods, and outcomes.
The paradigms used to improve the quality of work life have so far been based on the human relations theories related specializations such as Oraganisational and Human Resource Development. These in turn are based on their own models of man. To illustrate, the factors underlying QWL that have been identified are adequacy and equity in compensation, opportunity for growth and security of individual employees, and health and safety in working conditions. These factors are based on models of man, economics, social or complex, such as pleasure seeking and pain avoiding individual, or a man with a hierarchy of needs, or a person seeking power.
Sangeeta Jain (1991) in her comprehensively written book suggests that quality of work life is not a single or specific notion. Rather its umbrella encompasses several concepts like: industrial effectiveness, human resource development, organizational effectiveness, work restructure, job restructure working humanization, group work concept, labour-management cooperation, working together, workers’ involvement, and workers’ participation.
The present article is an exploratory study on the issues which affect the performance of employees working in this highly prospective sector of the economy.
J.M Juran (1992) stated that “without high quality physical working conditions, workers’ satisfaction may not be realized. This is true irrespective of the size or type of the business organisation- small, medium or big, service related or production related.”
An improvement in the quality of work life of handicraft workers shall lead to improved job satisfaction and hence better productivity. This is required for motivating skilled craftsmen and artisans to remain engaged in their profession of handicrafts and not quit it due to any adverse situation. This paper endeavours to find out the different constructs and variables which influence the quality of work life of handicraft employees.
Variables included in the study were selected after a review of the literature. The questionnaire was pilot tested on a small group of employees. 1000 questionnaires were send to four art metal ware craft clusters across India (Moradabad, Bidar, Jaipur and Balakati) out of which 410 were received back and 361 were found to be complete in all respects on which further analysis is done. A five point Likert scale was used to record the answers in which 1 indicated strongly disagree, 2 disagree, 3 indicated neither agree nor disagree, 4 indicated agree and 5 indicated strongly agree. This study is exploratory in nature.
Objectives of the study
The study attempts to identify the following objectives:
1) To assess the different factors influencing quality of work life of manpower working in the handicraft industries.
2) To identify and analyse the most important factors affecting the quality of work life.
Factors Affecting Quality of Work Life of Manpower Working with Handicraft Sector
- Adequate and Fair Compensation
In the study the descriptive statistics (mean, standard deviation and distribution statistics) are calculated from the responses for each variable of the construct. These descriptive statistics are shown in Table 1.
Table 1: Descriptive statistics
|
Variables |
Mean |
S.D |
Skewness |
Kurtosis |
|
Salary in comparison with cost of living |
2.687 |
1.067 |
0.264 |
-0.546 |
|
Salary in comparison with other organisations |
2.576 |
0.916 |
0.220 |
-0.329 |
|
Salary in comparison with employee’s ability |
2.521 |
0.904 |
0.142 |
-0.381 |
|
Overtime wages |
3.133 |
1.011 |
-0.074 |
-0.518 |
|
Incentives |
2.504 |
0.925 |
0.041 |
-0.747 |
|
Contribution to provident fund |
2.227 |
0.939 |
0.464 |
-0.177 |
|
Gratuity and group insurance |
2.404 |
1.029 |
0.436 |
-0.277 |
|
Advance payment in times of emergency |
2.291 |
0.952 |
0.437 |
-0.197 |
|
Prompt payment of salary |
3.706 |
0.993 |
-0.377 |
-0.455 |
|
Willingness to continue in job regardless of pay |
2.440 |
0.973 |
0.259 |
-0.551 |
The results indicate that the mean of the variables prompt payment of salary and overtime wages are high which indicate that most of the respondents in the study agree that they receive prompt payment of their wages. It is observed in the research study that most of the workers working in the handicraft industry receive their salary just after the completion of the month. The results also indicate that most of the employees are also satisfied with the overtime wages they get in their job. In handicraft industry due to overload of work during certain months they have to work for long hours for which they are duely paid extra wages. It is also found that the management of these organisations avoid to give any advance payments. In case of emergencies this may be due to the financial discipline of the units. In some of the organisations the number of workers are very less hence they do not get provident fund. The distribution of the responses seems to be normally distributed since the level of skewness and kurtosis is very low. The results of reliability and validity analysis are shown in Table 2.
Table 2
|
Construct Name |
Variables |
Cronbach Alpha |
Composite Reliability |
Average Variance extracted |
Maximum Shared Variance |
Average shared Variance |
|
Adequate and fair compensation |
Salary in comparison with cost of living |
0.945 |
0.946 |
0.636 |
0.008 |
0.003 |
|
Salary in comparison with other organizations |
||||||
|
Salary in comparison with employee’s ability |
||||||
|
Overtime wages |
||||||
|
Incentives |
||||||
|
Contribution to provident fund |
||||||
|
Gratuity and group insurance |
||||||
|
Advance payment in times of emergency |
||||||
|
Prompt payment of salary |
||||||
|
Willingness to continue in job regardless of pay |
The results indicate that the Cronbach Alpha of the variables in the construct Adequate and Fair Compensation is found to be 0.945 which ensures the presence of internal consistency reliability in the constructs. The Composite Reliability and Average Variance Extracted of the variables in the construct is found to be 0.946 and 0.636. This ensures that Convergent Validity of the construct exist. Because the Average Variance Extracted statistic is more than Maximum Shared Variance and Average Variance Extracted, Discriminant Validity of the construct also exists.
The construct (Adequate and Fair Compensation) along with its ten variables is shown in the figure 2. The results of the Construct Analysis are shown in Table 3.
Figure 1
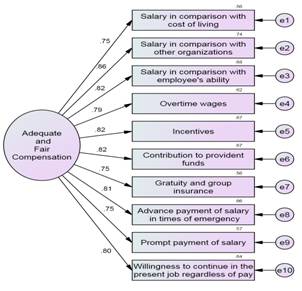
The Standardised Regression Weights of all the variables is more than 0.7 which indicates that each item of the construct is significantly representing the part of Adequate and Fair Compensation. In the results it is found that the Standardised Beta of the variable “Salary in Comparison with other Organisations” is the highest. This represents that the most influencing variable of the construct is the worker’s comparison of his compensation with the compensation provided by other organisations. It is observed in the study that if the worker has the perception that he got reasonable compensation provided by other organisations. It is observed in the study that if the worker has the perception that he got reasonable compensation as compared to compensation provided in other organisations, this adds positive feeling in the person and contributes to the quality of work life.
Table 3: Regression coefficients
|
Construct |
Variables |
Standardised Regression Weight |
Unstandardised Regression Weight |
CR |
P Value |
Multiple Correlation |
|
Adequate and fair compensation |
Salary in comparison with cost of living |
0.746 |
1.0 |
- |
.000 |
55.7% |
|
Salary in comparison with other organizations |
0.857 |
0.987 |
17.07 |
.000 |
73.5% |
|
|
Salary in comparison with employee’s ability |
0.821 |
0.933 |
16.26 |
.000 |
67.6% |
|
|
Overtime wages |
0.786 |
0.999 |
15.47 |
.000 |
61.9% |
|
|
Incentives |
0.819 |
0.952 |
16.20 |
.000 |
67.1% |
|
|
Contribution to provident fund |
0.821 |
0.968 |
16.22 |
.000 |
67.3% |
|
|
Gratuity and group insurance |
0.749 |
0.968 |
14.65 |
.000 |
56.1% |
|
|
Advance payment in times of emergency |
0.813 |
0.973 |
16.06 |
.000 |
66.1% |
|
|
Prompt payment of salary |
0.753 |
0.940 |
14.75 |
.000 |
56.8% |
|
|
Willingness to continue in job regardless of pay |
0.803 |
0.982 |
15.84 |
.000 |
64.5% |
The fitness of the construct is analyzed with the help of Goodness of Fit indices as well as Badness of Fit Indices as shown in the table 5. The Goodness of Fit Indices CFI (0.940), GFI (0.896), AGFI (0.837), and NFI (0.928) represent that the construct is statistically fit. Similarly the low values of Badness of Fit Indices represent the statistical fitness of the model.
Table 4: Model fitness indices
|
Goodness of Fit Indices |
Badness of Fit Indices |
|||||
|
CFI |
GFI |
AGFI |
NFI |
RMSEA |
LO 90 |
HI 90 |
|
0.940 |
0.896 |
0.837 |
0.928 |
0.115 |
0.100 |
0.131 |
Safe and Healthy Working Conditions
The second construct Safe and Healthy Working Conditions ensures that the safety of the employees is reasonably taken care of. This can in turn reduce the costs related to employee injury like including medical care, sick leave and disability benefit costs.This component of Quality of Work Life consist of fifteen measurable variables.
The descriptive statistics (mean, standard deviation and distribution statistics) are calculated from the responses for each variable of the construct i.e Safe and Healthy Working Conditions. These descriptive statistics are shown in Table 5.
Table 5
|
Variables |
Mean |
S.D |
Skewness |
Kurtosis |
|
Rest period
|
2.399 |
0.9228 |
0.406 |
-0.034 |
|
Canteen facility |
2.468 |
0.9188 |
0.235 |
-0.219 |
|
Drinking water facility |
2.994 |
0.9718 |
0.175 |
-0.387 |
|
First aid/ medical facilities |
2.756 |
0.9980 |
0.201 |
-0.336 |
|
Facilities for sports and games |
2.191 |
0.9034 |
0.364 |
-0.427 |
|
Library and reading room |
2.155 |
0.9118 |
0.550 |
-0.018 |
|
Lunch room
|
2.465 |
0.9513 |
0.217 |
-0.393 |
|
Sanitary facilities |
2.859 |
1.0591 |
0.186 |
-0.468 |
|
Ventilation and air circulation facilities |
2.776 |
1.0525 |
0.171 |
-0.540 |
|
Facilities for disposal of waste and dust |
2.551 |
0.9651 |
0.441 |
-0.124 |
|
Measures for controlling pollution |
2.565 |
1.0391 |
0.408 |
-0.234 |
|
Condition of machines and equipments |
3.889 |
0.9303 |
-0.423 |
-0.721 |
|
Safety plan |
2.618 |
0.9178 |
0.072 |
-0.426 |
|
Health care measures |
2.587 |
1.0267 |
0.290 |
-0.402 |
|
Health after day’s work |
2.512 |
0.9835 |
0.273 |
-0.445 |
The results indicate that the mean of the variable condition of machines and equipmentsis high (3.889) which indicate that most of the respondents in the research study agree that the condition of the machines and equipments in the handicraft units is fine. Similarly the mean score of sanitary facilities and drinking water facility is also comparitively high indicating the satisfaction of employees with regard to these two areas also. It is observed in the research study that the basic requirements like sanitary facilities and drinking water facility are in place in the handicraft units and as such the workers have a positive perception with regard to these two areas besides the condition of machines and equipments. The mean score of facilities for sports and games and facilities for library and reading room is the least indicating the dissatisfaction among the employees. These facilities help in the mental development of the employees are therefore important.
The distribution of the responses seems to be normally distributed since the level of skewness and kurtosis is very low. In majority cases the distribution is approximately symmetric as the values of skewness and kurtosis are between -0.5 and 0.5. The Construct Validity (convergent and discriminant validity) is measured by Composite Reliability, Average Variance Extracted, and Maximum Shared Variance. The results of reliability and validity analysis are shown in Table 6.
Table 6
|
Construct Name |
Variables |
Cronbach Alpha |
Composite Reliability |
Average Variance extracted |
Measured Shared Variance |
Average shared Variance |
|
Safe and healthy working conditions |
Rest period |
0.957 |
0.958 |
0.603 |
0.046 |
0.013 |
|
Canteen facility |
||||||
|
Drinking water facility |
||||||
|
First aid/ medical facilities |
||||||
|
Facilities for sports and games |
||||||
|
Library and reading room |
||||||
|
Lunch room |
||||||
|
Sanitary facilities |
||||||
|
Ventilation and air circulation facilities |
||||||
|
Facilities for disposal of waste and dust |
||||||
|
Measures for controlling pollution |
||||||
|
Condition of machines and equipments |
||||||
|
Safety plan |
||||||
|
Health care measures |
||||||
|
Health after day’s work |
The results indicate that the Cronbach Alpha of the variables in the construct Safe and healthy working conditionsis found to be 0.957 which ensures the presence of internal consistency and reliability in the constructs. The Composite Reliability and Average Variance Extracted of the variables in the construct is found to be 0.958 and 0.603. This ensures that Convergent Validity of the construct exist. Because the Average Variance Extracted statistic is more than Maximum Shared Variance and Average Variance Extracted, Discriminant Validity of the construct also exists.
The construct (Safe and healthy working conditions) is shown in the figure 2. The results of the Construct Analysis are shown in Table 7.
Figure 2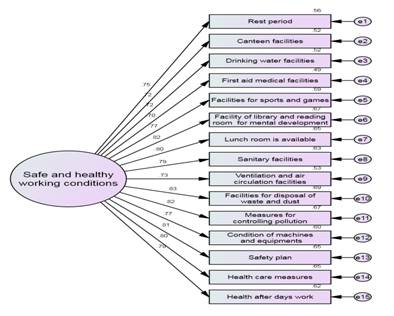
It is found that the Standardised Regression Weights of all the variables is more than 0.7 which indicates that each item of the construct is significantly representing the part of Safe and Healthy Working Condtions. The Standardised Regression Weights represent the corelation between the measured variable and the construct. In the results it is found that the Standardised Beta of the variable “Facilities for disposal of waste and dust” is the highest. This represents that the most influencing variable of the construct is the facilities and measures taken by the organisation for the disposal of waste and dust. Since these measures bring upon a significant and direct influence on workers’ health, they are of prime importance. The dust produced in handicraft units especially brass units can bring an adverse impact on workers’ respiratory system and thus can inturn influence his/her quality of work life.
Table 7
|
Construct |
Variables |
Standardised Regression Weight |
Unstandardised Regression Weight |
CR |
P Value |
Multiple Correlation |
|
Safe and healthy working conditions |
Rest period |
0.751 |
0.861 |
16.821 |
000 |
56.3% |
|
Canteen facility |
0.724 |
0.826 |
15.97 |
000 |
52.4% |
|
|
Drinking water facility |
0.724 |
0.874 |
15.97 |
000 |
52.4% |
|
|
First aid/ medical facilities |
0.701 |
0.870 |
15.28 |
000 |
49.2% |
|
|
Facilities for sports and games |
0.765 |
0.859 |
17.31 |
000 |
58.6% |
|
|
Library and reading room |
0.816 |
0.925 |
19.10 |
000 |
66.7% |
|
|
Lunch room |
0.804 |
0.951 |
18.65 |
000 |
64.7% |
|
|
Sanitary facilities |
0.792 |
1.042 |
18.22 |
000 |
62.7% |
|
|
Ventilation and air circulation facilities |
0.762 |
0.950 |
16.04 |
000 |
52.7% |
|
|
Facilities for disposal of waste and dust |
0.834 |
1.000 |
- |
000 |
69.5% |
|
|
Measures for controlling pollution |
0.820 |
1.059 |
19.24 |
000 |
67.2% |
|
|
Condition of machines and equipments |
0.773 |
0.894 |
17.58 |
000 |
59.8% |
|
|
Safety plan
|
0.808 |
0.921 |
18.79 |
000 |
65.3% |
|
|
Health care measures |
0.804 |
1.035 |
18.64 |
000 |
64.6% |
|
|
Health after day’s work |
0.789 |
0.964 |
18.12 |
000 |
62.3% |
The fitness of the construct is analysed with the help of Goodness of Fit indices as well as Badness of Fit Indices as shown in the Table 8. The Goodness of Fit Indices CFI (0.956), GFI (0.921), AGFI (0.894), and NFI (0.935) represent that the construct is statistically fit. Similarly the low values of Badness of Fit Indices represent the statistical fitness of the model.
Table 8: Model Fitness
|
Goodness of Fit Indices
|
Badness of Fit Indices |
|||||
|
CFI |
GFI |
AGFI |
NFI |
RMSEA |
LO 90 |
HI 90 |
|
0.956 |
0.921 |
0.894 |
0.935 |
0.075 |
0.065 |
0.085 |
Immediate Opportunity to Use and Develop Human Capacities
The third construct of the scale measuring the Quality of Work Life is defined as “Immediate Opportunity to Use and Development of Human Capacities”. The work in handicraft industry is more or less repetitive in nature. The employee get little or no opportunity to exercise their creative skills. Quality of working life can be improved significantly if the job allows some amount of autonomy. Autonomy here means The degree to which the job provides substantial freedom independence and discretion to the individual in scheduling the work and in determining the procedures to be used in carrying it out.
The descriptive statistics are shown in Table 9.
Table 9
|
Variables |
Mean |
S.D |
Skewness |
Kurtosis |
|
Organizational structure |
2.684 |
0.9006 |
0.344 |
-0.040 |
|
Appreciation of employee’s idea to bring new changes |
2.493 |
0.8886 |
0.296 |
-0.064 |
|
Appreciation of employee’s idea to bring new changes |
2.330 |
0.9715 |
0.451 |
-0.152 |
|
Clarity and transparency in communication |
2.238 |
0.9825 |
0.532 |
-0.175 |
|
Freedom in work |
2.271 |
1.0075 |
0.517 |
-0.264 |
|
Provision for information about work, work process and its result |
2.241 |
0.9575 |
0.437 |
-0.382 |
|
Provision for self improvement of employees |
2.186 |
0.9436 |
0.499 |
-0.251 |
|
Attitude of supervisor |
2.260 |
1.1242 |
0.399 |
-0.574 |
|
Equitable treatment |
2.748 |
1.0111 |
0.230 |
-0.434 |
|
Appreciation of good work |
2.377 |
1.0311 |
0.372 |
-0.595 |
The results indicate that the mean of the variable Equitable Treatment is high which indicates that most of the respondents in the study agree that the employees are given equitable treatement. It is observed in the study that the employees are not treated biasedly in their organisations. They get equitable treatement irrespective of their religion, age, gender etc. The mean score is the least in case of provision for self improvement of employees which indicate that the handicraft sector units are not as such concerned and take care of the self improvement of the employees. The distribution of the responses seems to be normally distributed since the level of skewness and kurtosis is very low. The results of reliability and validity analysis are shown in Table 10.
Table 10
|
Construct Name |
Variables |
Cronbach Alpha |
Composite Reliability |
Average Variance extracted |
Measured Shared Variance |
Average shared Variance |
|
Development of Human Capacities |
Organizational structure |
0.952 |
0.953 |
0.669 |
0.046 |
0.016 |
|
Appreciation of employee’s idea to bring new changes |
||||||
|
Appreciation of employee’s idea to bring new changes |
||||||
|
Clarity and transparency in communication |
||||||
|
Freedom in work |
||||||
|
Provision for information about work, work process and its result |
||||||
|
Provision for self improvement of employees |
||||||
|
Attitude of supervisor |
||||||
|
Equitable treatment |
||||||
|
Appreciation of good work |
The results indicate that the Cronbach Alpha of the variables in the construct Safe and healthy working conditionsis found to be 0.952 which ensures the presence of internal consistency and reliability in the constructs. The Composite Reliability and Average Variance Extracted of the variables in the construct is found to be 0.953 and 0.669. This ensures that Convergent Validity of the construct exist. Because the Average Variance Extracted statistic is more than Maximum Shared Variance and Average Variance Extracted, Discriminant Validity of the construct also exists.
The construct (Development of human capacities) is shown in the figure 3. The results of the Construct Analysis are shown in Table 11.
Figure 3
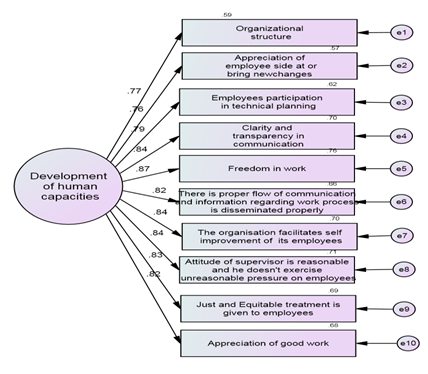
It is found that the Standardised Regression Weights of all the variables is more than 0.7 which indicates that each item of the construct is significantly representing the part of Development of Human Capacities. The Standardised Regression Weights represent the corelation between the measured variable and the construct. In the results it is found that the Standardised Beta of the variable “freedom in organisation” is the highest (0.87). This represents that the most influencing variable of the construct is the employees’ freedom in the organisation.
Table 11
|
Construct |
Variables |
Standardised Regression Weight |
Unstandardised Regression Weight |
CR |
P Value |
Multiple Correlation |
|
Development of Human Capacities |
Organizational structure
|
0.771 |
0.816 |
17.19 |
000 |
59.4% |
|
Appreciation of employee’s idea to bring new changes |
0.758 |
0.791 |
16.77 |
000 |
57.4% |
|
|
Appreciation of employee’s idea to bring new changes |
0.786 |
0.898 |
17.70 |
000 |
61.8% |
|
|
Clarity and transparency in communication |
0.838 |
0.968 |
19.52 |
000 |
70.3% |
|
|
Freedom in work
|
0.869 |
1.029 |
20.67 |
000 |
75.5% |
|
|
Provision for information about work, work process and its result |
0.815 |
0.918 |
18.69 |
000 |
66.5% |
|
|
Provision for self improvement of employees |
0.839 |
0.931 |
19.53 |
000 |
70.4% |
|
|
Attitude of supervisor
|
0.844 |
1.116 |
19.73 |
000 |
71.3% |
|
|
Equitable treatment |
0.829 |
0.986 |
19.18 |
000 |
68.7% |
|
|
Appreciation of good work |
0.825 |
1.00 |
- |
000 |
68.1% |
The fitness of the construct is analyzed with the help of Goodness of Fit indices as well as Badness of Fit Indices as shown in the Table 12. The Goodness of Fit Indices CFI (0.991), GFI (0.968), AGFI (0.949), and NFI (0.980) represent that the construct is statistically fit. Similarly the low values of Badness of Fit Indices represent the statistical fitness of the model.
Table 12: Model Fit Indices
|
Goodness of Fit Indices |
Badness of Fit Indices |
|||||
|
CFI |
GFI |
AGFI |
NFI |
RMSEA |
LO 90 |
HI 90 |
|
0.991 |
0.968 |
0.949 |
0.980 |
0.045 |
0.025 |
0.063 |
Opportunity for Career Growth
The fourth construct of the scale measuring the Quality of Work Life is Opportunity for Career Growth.
The descriptive statistics are shown in Table 13.
Table 13
|
Variables |
Mean |
S.D |
Skewness |
Kurtosis |
|
Assignment of work on the basis of abilities |
2.374 |
0.9287 |
0.320 |
-0.367 |
|
Work of organizational planning, research & development |
2.025 |
0.8987 |
0.167 |
0.181 |
|
Assignment of work within the limits of workers’ ability |
2.224 |
0.8832 |
0.348 |
-0.444 |
|
Facilities for individual creative work |
2.219 |
0.8846 |
0..598 |
0.312 |
|
Facilities for using new knowledge for further work |
2.319 |
0.9255 |
0.425 |
-0.069 |
|
Opportunities for improvement of job |
3.327 |
0.9992 |
0.484 |
-0.211 |
|
Training |
3.202 |
1.0412 |
-0.205 |
-0.334 |
|
Job rotation |
2.152 |
0.9408 |
0.799 |
0.629 |
|
Promotion opportunities |
2.216 |
0.9904 |
0.608 |
-0.56 |
|
Performance appraisal based on objective assessment |
2.224 |
0.9644 |
0.491 |
-0.277 |
|
Appreciation of idea to make new changes |
2.440 |
0.9986 |
0.426 |
-0.144 |
|
Willingness to continue in the organization till retirement |
2.044 |
0.8995 |
0.626 |
0.010 |
The results indicate that the mean of the variables Opportunities for improvement of job and training are high which indicate that most of the respondents in the study agree that they receive ample opportunities for the improvement and upgradation of their job related skills as well as they receive training for the improvement and upgradation of their skills. The results also indicate that most of the employees are also satisfied with the training they get in their job. In handicraft industry due to intense competition from countries like China, Germany etc. the employees need to upgrade their skills so that they may remain contemporary.
It is also found that the management of these organisations avoid to involve the employees in the job of organizational planning, research &development. This might create demotivation for the employees as they feel left out when it comes to planning issues. A number of employees are highly innovative and creative which is indeed important for handicraft sector. But, when they are not involved in such issues their motivation level is affected. The results of reliability and validity analysis are shown in Table 14.
Table 14
|
Construct Name |
Variables |
Cronbach Alpha |
Composite Reliability |
Average Variance extracted |
Measured Shared Variance |
Average shared Variance |
|
Opportunity for career growth |
Assignment of work on the basis of abilities |
0.948 |
0.948 |
0.604 |
0.034 |
0.016 |
|
Work of organizational planning, research & development |
||||||
|
Assignment of work within the limits of workers’ ability |
||||||
|
Facilities for individual creative work |
||||||
|
Facilities for using new knowledge for further work |
||||||
|
Opportunities for improvement of job |
||||||
|
Training |
||||||
|
Job rotation |
||||||
|
Promotion opportunities |
||||||
|
Performance appraisal based on objective assessment |
||||||
|
Appreciation of idea to make new changes |
||||||
|
Willingness to continue in the organization till retirement |
The results indicate that the Cronbach Alpha of the variables in the construct Opportunity for Career Growthis found to be 0.948 which ensures the presence of internal consistency and reliability in the constructs. The Composite Reliability and Average Variance Extracted of the variables in the construct is found to be 0.948 and 0.604. This ensures that Convergent Validity of the construct exist. Because the Average Variance Extracted statistic is more than Maximum Shared Variance and Average Variance Extracted, Discriminant Validity of the construct also exists.
The construct Opportunity for Career Growth is shown in the figure 4. The results of the Construct Analysis are shown in Table 15.
Figure 4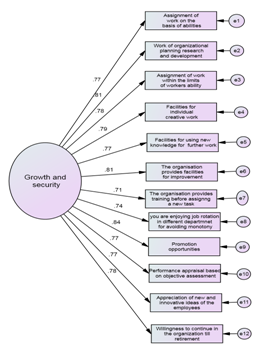
It is found that the Standardised Regression Weights of all the variables is more than 0.7 which indicates that each item of the construct is significantly representing the part of Opportunity for career growth. The Standardised Regression Weights represent the corelation between the measured variable and the construct. In the results it is found that the Standardised Beta of the variable “Promotion Opportunities” is the highest. This represents that the most influencing variable of the construct is the promotion opportunities provided by the organisation to its employees. The employees are of the perception that ample promotion opportunities are available to them in the handicraft unit they are working with. This adds to the motivation of the employees working with the handicraft sector.
Table 15
|
Construct |
Variables |
Standardised Regression Weight |
Unstandardised Regression Weight |
CR |
P Value |
Multiple Correlation |
|
Opportunity for career growth |
Assignment of work on the basis of abilities |
0.769 |
0.968 |
15.56 |
000 |
59.2% |
|
Work of organizational planning, research & development |
0.810 |
0.986 |
16.58 |
000 |
65.6% |
|
|
Assignment of work within the limits of workers’ ability |
0.778 |
0.931 |
15.79 |
000 |
60.5% |
|
|
Facilities for individual creative work |
0.786 |
0.941 |
15.97 |
000 |
61.7% |
|
|
Facilities for using new knowledge for further work |
0.766 |
0.961 |
15.50 |
000 |
58.7% |
|
|
Opportunities for improvement of job |
0.807 |
1.093 |
16.52 |
000 |
65.2% |
|
|
Training |
0.710 |
1.002 |
14.18 |
000 |
50.5%
|
|
|
Job rotation |
0.744 |
0.948 |
14.96 |
000 |
55.3%
|
|
|
Promotion opportunities |
0.836
|
1.121 |
17.23 |
000 |
69.8% |
|
|
Performance appraisal based on objective assessment |
0.765 |
1.000 |
- |
000 |
58.6% |
|
|
Appreciation of idea to make new changes |
0.765 |
1.035 |
15.48 |
000 |
58.6% |
|
|
Willingness to continue in the organization till retirement |
0.783 |
0.954 |
15.91 |
000 |
61.3% |
Table 16
|
Goodness of Fit Indices |
Badness of Fit Indices |
|||||
|
CFI |
GFI |
AGFI |
NFI |
RMSEA |
LO 90 |
HI 90 |
|
0.965 |
0.928 |
0.896 |
0.949 |
0.074 |
0.061 |
0.087 |
Social Integration in the Work Organisation
The fifth construct of the scale measuring the Quality of Work Life is defined as “Social Integration in the Work Organisation”. According to Walton, five important elemnets whichmust be present in any work organisation are: freedom from prejudice, egalitarianism, upward mobility, supportive work groups,and community feelings and interpersonal openness. These elements help in involving the employees socially in the organisation. This integration is essential to help improving the quality of work life.This construct of Quality of Work Life consist of fifteen measurable variables. The descriptive statistics are shown in Table 17.
Table 17
|
Variables |
Mean |
S.D |
Skewness |
Kurtosis |
|
Employees’ feeling of sense of oneness and unison |
3.302 |
0.9311 |
-0.324 |
-0.107 |
|
Identification of an employee purely on the basis of skills, without any regard of race, sex age etc. |
3.490 |
0.9975 |
-0.277 |
-0.445 |
|
Employees’ interaction in terms of ideas and feelings |
3.127 |
1.0383 |
-0.108 |
-0.532 |
|
Easiness in working as a group |
3.476 |
0.9973 |
-0.340 |
-0.330 |
|
Preference to work collectively than individually |
3.366 |
0.9968 |
-0.243 |
-0.352 |
|
Concern of management towards the grievances of the employees |
2.454 |
0.9965 |
-0.296 |
-0.450 |
|
Consideration of employees’ views in resolving problems |
2.086 |
0.8856 |
0.410 |
-0.502 |
|
Encouragement of organization in reciprocal help |
2.238 |
0.8999 |
0.248 |
-0.622 |
|
Employees’ acceptance of rapid changes in technology |
3.249 |
1.0049 |
-0.219 |
-0.388 |
|
Employees’ cooperation for expansion and diversification |
3.476 |
0.9604 |
-0.358 |
-0.184 |
|
Participation in decision making process |
2.144 |
0.9811 |
0.560 |
-0.362 |
|
Consultation by the supervisor before taking decisions |
2.391 |
0.9774 |
0.372 |
-0.347 |
|
Co- workers relationship |
3.391 |
0.9887 |
-0.240 |
-0.395 |
|
Subordinate- superior- relationship |
2.726 |
1.0513 |
0.206 |
-0.552 |
|
Management- workers relationship |
2.521 |
1.0516 |
0.363 |
-0.450 |
The results indicate that the mean of the variable Identification of an employee purely on the basis of skills, without any regard of race, sex age etc.is the highest which indicate that there is no discrimination on the basis of gender, race age etc. in the handicraft units which were a part of the research study. The results of reliability and validity analysis are shown in Table 18.
Table 18
|
Construct Name |
Variables |
Cronbach Alpha |
Composite Reliability |
Average Variance extracted |
Measured Shared Variance |
Average shared Variance |
|
Social integration in the work organization |
Employees’ feeling of sense of oneness and unison |
0.959 |
0.960 |
0.613 |
0.015 |
0.005 |
|
Identification of an employee purely on the basis of skills, without any regard of race, sex age etc. |
||||||
|
Employees’ interaction in terms of ideas and feelings |
||||||
|
Easiness in working as a group |
||||||
|
Preference to work collectively than individually |
||||||
|
Concern of management towards the grievances of the employees |
||||||
|
Consideration of employees’ views in resolving problems |
||||||
|
Encouragement of organization in reciprocal help |
||||||
|
Employees’ acceptance of rapid changes in technology |
||||||
|
Employees’ cooperation for expansion and diversification |
||||||
|
Participation in decision making process |
||||||
|
Consultation by the supervisor before taking decisions |
||||||
|
Co- workers relationship |
||||||
|
Subordinate- superior- relationship |
||||||
|
Management- workers relationship |
The results indicate that the Cronbach Alpha of the variables in the construct Social Integration in the Work Organisationis found to be 0.959 which ensures the presence of internal consistency and reliability in the constructs. The Composite Reliability and Average Variance Extracted of the variables in the construct is found to be 0.960 and 0.613. This ensures that Convergent Validity of the construct exist. Because the Average Variance Extracted statistic is more than Maximum Shared Variance and Average Variance Extracted, Discriminant Validity of the construct also exists.
The construct (Social Integration in the Work Organisation) along with its fifteen variables is shown in the figure 5 the results of the Construct Analysis are shown in Table 19.
Figure 5
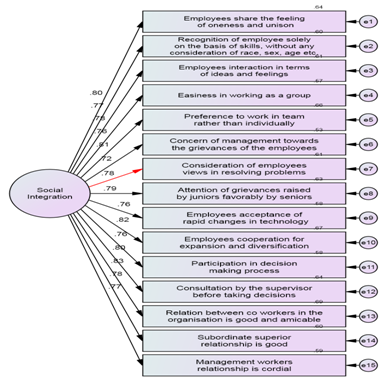
It is found that the Standardised Regression Weights of all the variables is more than 0.7 which indicates that each item of the construct is significantly representing the part of Social Integration in the Work Organisation. The Standardised Regression Weights represent the corelation between the measured variable and the construct. In the results it is found that the Standardised Beta of the variable “relation between co workers in the organisation is good and amicable” is the highest. This represents that the most influencing variable of the construct is the friendly and healthy relationship exists between the employees working in the handicraft units. This adds to their quality of work life. Besides amicable relationship amongst co workers.
Table 19
|
Construct |
Variables |
Standardised Regression Weight |
Unstandardised Regression Weight |
CR |
P Value |
Multiple Correlation |
|
Social integration in the work organization |
Employees’ feeling of sense of oneness and unison |
0.798 |
0.948 |
17.91 |
000 |
63.7% |
|
Identification of an employee purely on the basis of skills, without any regard of race, sex age etc. |
0.775 |
0.986 |
17.15 |
000 |
60.0% |
|
|
Employees’ interaction in terms of ideas and feelings |
0.783 |
1.038 |
17.43 |
000 |
61.4% |
|
|
Easiness in working as a group |
0.757 |
0.963 |
16.599 |
000 |
57.3% |
|
|
Preference to work collectively than individually |
0.813 |
1.034 |
18.401 |
000 |
66.1% |
|
|
Concern of management towards the grievances of the employees |
0.724 |
0.921 |
15.64 |
000 |
52.5% |
|
|
Consideration of employees’ views in resolving problems |
0.779 |
0.880 |
17.29 |
000 |
60.7% |
|
|
Encouragement of organization in reciprocal help |
0.791 |
0.908 |
17.68 |
000 |
62.6% |
|
|
Employees’ acceptance of rapid changes in technology |
0.763 |
0.978 |
16.79 |
000 |
58.2% |
|
|
Employees’ cooperation for expansion and diversification |
0.816 |
1.000 |
- |
000 |
66.6% |
|
|
Participation in decision making process |
0.763 |
0.955 |
16.79 |
000 |
58.2% |
|
|
Consultation by the supervisor before taking decisions |
0.803 |
1.001 |
18.07 |
000 |
61.3% |
|
|
Co- workers relationship |
0.831 |
1.049 |
19.02 |
000 |
69.1% |
|
|
Subordinate- superior- relationship |
0.776 |
1.041 |
17.20 |
000 |
60.2% |
|
|
Management- workers relationship |
0.769 |
1.031 |
16.96 |
000 |
59.1% |
The fitness of the construct is analysed with the help of Goodness of Fit indices as well as Badness of Fit Indices as shown in the Table 20. The Goodness of Fit Indices CFI (0.940), GFI (0.883), AGFI (0.844), and NFI (0.920) represent that the construct is statistically fit. Similarly the low values of Badness of Fit Indices represent the statistical fitness of the model.
Table 20
|
Goodness of Fit Indices |
Badness of Fit Indices |
|||||
|
CFI |
GFI |
AGFI |
NFI |
RMSEA |
LO 90 |
HI 90 |
|
0.940 |
0.883 |
0.844 |
0.920 |
0.089 |
0.079 |
0.099 |
Constitutionalism in the Work Organisations
The sixth construct of the scale measuring the Quality of Work Life is defined as Constitutionalism in the Work Organisation. The descriptive statistics are shown in Table 21.
Table 21
|
Variables |
Mean |
S.D |
Skewness |
Kurtosis |
|
Taking care of the welfare of workers of all ages |
2.526 |
0.9399 |
0.246 |
-0.305 |
|
Equal treatment to all the employees |
2.501 |
0.9920 |
0.322 |
-0.406 |
|
Different approaches to work according to the nature of job and ability of the employee |
2.404 |
0.9113 |
0.330 |
-0.198 |
|
Maintenance of privacy regarding personal matters |
3.482 |
0.9459 |
-0.285 |
-0.162 |
|
Functioning of a conflict resolution mechanism |
2.355 |
0.9077 |
0.315 |
-0.259 |
The results indicate that the mean of the variable Maintenance of privacy regarding personal matters is high which indicate that the employees perceive that their privacy regarding their personal matters in the organisation is respected. The employees may not feel like or may not be comfortable in sharing their persoanl issues at the work place. The employers in the handicraft units under study maintain this privacy of the employees which helps in developing a positive feeling in the employees. On the contrary the mean score of is the lowest (2.355) which indicates the low level of satisfaction of the employees with regard to functioning of a conflict resolution mechanism. This indicates that the conflict resolution mechanism is not in place in the handicraft sector units and employees are not quite satisfied with it. The distribution of the responses seems to be normally distributed since the level of skewness and kurtosis is very low. The results of reliability and validity analysis are shown in Table 22.
Table 22
|
Construct Name |
Variables |
Cronbach Alpha |
Composite Reliability |
Average Variance extracted |
Measured Shared Variance |
Average shared Variance |
|
Constitutionalism in the work organization |
Taking care of the welfare of workers of all ages |
0.910 |
0.910 |
0.670 |
0.009 |
0.003 |
|
Equal treatment to all the employees |
||||||
|
Different approaches to work according to the nature of job and ability of the employee |
||||||
|
Maintenance of privacy regarding personal matters |
||||||
|
Functioning of a conflict resolution mechanism |
||||||
|
Equal treatment to all the employees |
||||||
|
Different approaches to work according to the nature of job and ability of the employee |
||||||
|
Maintenance of privacy regarding personal matters |
||||||
|
Functioning of a conflict resolution mechanism |
The results indicate that the Cronbach Alpha of the variables in the construct Constitutionalism in the work organizationis found to be 0.910 which ensures the presence of internal consistency reliability in the constructs. The Composite Reliability and Average Variance Extracted of the variables in the construct is found to be 0.910 and 0.670. this ensures that Convergent Validity of the construct exist.
The construct (Adequate and Fair Compensation) along with its ten variables is shown in the figure 6. The results of the Construct Analysis are shown in Table 23.
Figure 6
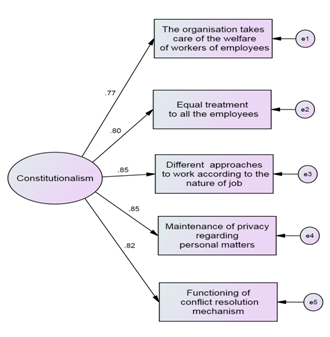
It is found that the Standardised Regression Weights of all the variables is more than 0.7 which indicates that each item of the construct is significantly representing the part of Constitutionalism.The Standardised Regression Weights represent the corelation between the measured variable and the construct. In the results it is found that the Standardised Beta of two variables “Different approaches to work according to the nature of the job” and “Maintenance of privacy regarding personal matters” is the highest. It is observed in the study that if the worker has the perception that the organisation follows different approaches or tailor makes its approaches to suit the requirement of the work, that brings the employees in the comfort zone of working in that particular organisation and in turn contribute to the quality of work life. Moreover, the persoanl space of the employees is respected i.e. due privacy is maintained in personal matters. This enhances quality of work life.
Table 23
|
Construct |
Variables |
Standardised Regression Weight |
Unstandardised Regression Weight |
CR |
P Value |
Multiple Correlation |
|
Constitutionalism in the work organization |
Taking care of the welfare of workers of all ages |
0.771 |
1.000 |
|
000 |
59.6% |
|
Equal treatment to all the employees |
0.799 |
1.093 |
15.931 |
000 |
64.0% |
|
|
Different approaches to work according to the nature of job and ability of the employee |
0.854 |
1.073 |
17.225 |
000 |
72.7% |
|
|
Maintenance of privacy regarding personal matters |
0.849 |
1.108 |
17.126 |
000 |
72.2% |
|
|
Functioning of a conflict resolution mechanism |
0.815 |
1.021 |
16.325 |
000 |
66.5% |
The fitness of the construct is analysed with the help of Goodness of Fit indices as well as Badness of Fit Indices as shown in the Table 24. The Goodness of Fit Indices CFI (0.991), GFI (0.983), AGFI (0.949), and NFI (0.987) represent that the construct is statistically fit. Similarly the low values of Badness of Fit Indices represent the statistical fitness of the model.
Table 24
|
Goodness of Fit Indices |
Badness of Fit Indices |
|||||
|
CFI |
GFI |
AGFI |
NFI |
RMSEA |
LO 90 |
HI 90 |
|
0.991 |
0.983 |
0.949 |
0.987 |
0.075 |
0.034 |
0.120 |
Work and Total Life Space
The seventh construct of the scale measuring the Quality of Work Life is defined as Work and Total Life Space. Thee descriptive statistics are shown in Table 25.
Table 25
|
Variables |
Mean |
S.D |
Skewness |
Kurtosis |
|
Satisfaction of employees’ needs by the job |
2.463 |
0.9969 |
0.357 |
-0.312 |
|
Awareness about health in spite of the nature of the job |
2.681 |
1.0088 |
0.247 |
-0.331 |
|
Social and individual requirements |
2.604 |
1.0060 |
0.199 |
-0.467 |
|
Effect of energy and time spent on the job on workers’ life |
2.249 |
0.9938 |
0.593 |
-0.106 |
The results indicate that the mean of the variable awareness about health inspite of the nature of job is the highest which indicates that most of the respondents in the study agree that they are in general aware about the implications of job on their health. The distribution of the responses seems to be normally distributed since the level of skewness and kurtosis is very low. The results of reliability and validity analysis are shown in Table 26.
Table 26
|
Construct Name |
Variables |
Cronbach Alpha |
Composite Reliability |
Average Variance extracted |
Measured Shared Variance |
Average shared Variance |
|
Work and total life space |
Satisfaction of employees’ needs by the job |
0.862 |
0.862 |
0.609 |
0.034 |
0.010 |
|
Awareness about health in spite of the nature of the job |
||||||
|
Social and individual requirements |
||||||
|
Effect of energy and time spent on the job on workers’ life |
The results indicate that the Cronbach Alpha of the variables in the construct Work and total life space is found to be 0.862 which ensures the presence of internal consistency reliability in the constructs. The Composite Reliability and Average Variance Extracted of the variables in the construct is found to be 0.862 and 0.609. This ensures that Convergent Validity of the construct exist. Because the Average Variance Extracted statistic is more than Maximum Shared Variance and Average Variance Extracted, Discriminant Validity of the construct also exists.
The construct Work and Total Life Space is shown in the figure 7. The results of the Construct Analysis are shown in Table 27.
Figure 8
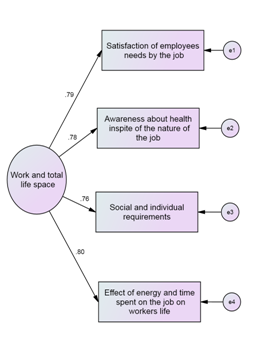
It is found that the Standardised Regression Weights of all the variables is more than 0.7 which indicates that each item of the construct is significantly representing the part of Work and total life space. The Standardised Regression Weights represent the corelation between the measured variable and the construct. In the results it is found that the Standardised Beta of the variable “Effect of energy and time spent on the job on worker’s life” is the highest. This indicates that the time and energy spent by the employees in their work organisations has a positive bearing on their life. It is observed in the study that if the employee has a perception that the time and energy he is spending in his organisation is worth it, it adds to the positive feeling in the person and contributes to the betterment of quality of work life.
Table 28
|
Construct |
Variables |
Standardised Regression Weight |
Unstandardised Regression Weight |
CR |
P Value |
Multiple Correlation |
|
Work and total life space |
Satisfaction of employees’ needs by the job |
0.786 |
1.000 |
|
|
62.4% |
|
Awareness about health in spite of the nature of the job |
0.779 |
1.003 |
14.674 |
000 |
60.4% |
|
|
Social and individual requirements |
0.759 |
0.974 |
14.283 |
000 |
57.4% |
|
|
Effect of energy and time spent on the job on workers’ life |
0.798 |
1.013 |
15.015 |
000 |
63.5% |
The fitness of the construct is analysed with the help of Goodness of Fit indices as well as Badness of Fit Indices as shown in the Table 29. The Goodness of Fit Indices CFI (0.996), GFI (0.996), AGFI (0.978), and NFI (0.995) represent that the construct is statistically fit. Similarly the low values of Badness of Fit Indices represent the statistical fitness of the model.
Table 29
|
Goodness of Fit Indices |
Badness of Fit Indices |
|||||
|
CFI |
GFI |
AGFI |
NFI |
RMSEA |
LO 90 |
HI 90 |
|
0.998 |
0.996 |
0/978 |
0.995 |
0.042 |
0.000 |
0.121 |
Social Relevance of the Working Life
The frequency distribution of the responses is shown in Table 30. below.
Table 30
|
Variables |
Strongly Disagree |
Disagree |
Neither Agree or Disagree |
Agree |
Strongly agree |
|
Social responsibility of the organization |
2 (0.6%) |
29 (8.0%) |
137 (38.0%) |
144 (39.9%) |
49 (13.6%) |
|
Nature of job and social prestige |
50 (13.9%) |
138 (38.2%) |
132 (36.6%) |
36 (10.0%) |
5 (1.4%) |
|
Effect of job to improve social security |
73 (20.2%) |
155 (42.9%) |
102 (28.3) |
28 (7.8%) |
3 (8.0%) |
|
Nature of organizational goals |
19 (5.3%) |
93 (25.8%) |
147 (40.7%) |
78 (21.6%) |
24 (6.6%) |
|
Matching of work life and social life |
61 (16.9%) |
152 (42.1%) |
115 (31.9%) |
31 (8.6%) |
2 (0.6%) |
|
Organization’s awareness of method of industrial pollution |
38 (10.5%) |
110 (30.5%) |
142 (39.3%) |
54 (15.0%) |
17 (4.7%) |
|
Price of goods and services from social point of view |
54 (15.0%) |
138 (38.2%) |
124 (34.3%) |
4 (11.1%) |
5 (1.4%) |
|
Importance to quality of products and services |
0 (0.0%) |
29 (8.0%) |
125 (34.6%) |
147 (40.7%) |
60 (16.6%) |
|
Contribution towards improving culture of the society |
72 (19.9%) |
147 (40.7%) |
116 (32.1%) |
24 (6.6%) |
2 (0.6%) |
In the study the descriptive statistics (mean, standard deviation and distribution statistics) are calculated from the responses for each variable of the construct. These descriptive statistics are shown in Table 31.
Table 31
|
Variables |
Mean |
S.D |
Skewness |
Kurtosis |
|
Social responsibility of the organization |
3.579 |
0.8433 |
-0.110 |
-0.297 |
|
Nature of job and social prestige |
2.468 |
0.9004 |
0.222 |
-0.219 |
|
Effect of job to improve social security |
2.260 |
0.8968 |
0.393 |
-0.226 |
|
Nature of organizational goals |
2.986 |
0.9760 |
0.118 |
-0.346 |
|
Matching of work life and social life |
2.338 |
0.8768 |
0.225 |
-0.366 |
|
Organization’s awareness of method of industrial pollution |
2.729 |
0.9964 |
0.210 |
-0.261 |
|
Price of goods and services from social point of view |
2.457 |
0.9243 |
0.243 |
-0.332 |
|
Importance to quality of products and services |
3.659 |
0.8484 |
-0.082 |
-0.630 |
|
Contribution towards improving culture of the society |
2.271 |
0.8746 |
0.244 |
-0.386 |
The results indicate that the mean of the variable Importance to quality of products and services is the highest. This implies that most of the respondents in the study agree that the handicraft units lay emphasis on the quality of products and services. Infact this variable remains quite important for the handicraft sector because the rate of rejection is also very high in case the product do not meet the specifications of the buyers. The distribution of the responses is normally distributed since the level of skewness and kurtosis is very low. The results of reliability and validity analysis are shown in Table 32.
Table 32
|
Construct Name |
Variables |
Cronbach Alpha |
Composite Reliability |
Average Variance extracted |
Measured Shared Variance |
Average shared Variance |
|
Social relevance of the working life |
Social responsibility of the organization |
0.931 |
0.932 |
0.604 |
0.030 |
0.011 |
|
Nature of job and social prestige |
||||||
|
Effect of job to improve social security |
||||||
|
Nature of organizational goals |
||||||
|
Matching of work life and social life |
||||||
|
Organization’s awareness of method of industrial pollution |
||||||
|
Price of goods and services from social point of view |
||||||
|
Importance to quality of products and services |
||||||
|
Contribution towards improving culture of the society |
The results indicate that the Cronbach Alpha of the variables in the construct Social relevance of the working life is found to be 0.931 which ensures the presence of internal consistency reliability in the constructs. The Composite Reliability and Average Variance Extracted of the variables in the construct is found to be 0.932 and 0.604. This ensures that Convergent Validity of the construct exist. Since the Average Variance Extracted statistic is more than Maximum Shared Variance and Average Variance Extracted, Discriminant Validity of the construct also exists. The construct Social relevance of the working life is shown in the figure 8 the results of the Construct Analysis are shown in Table 33.
Figure 8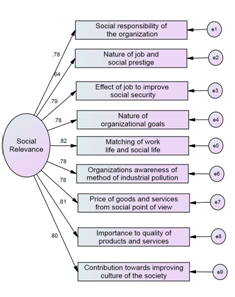
It is found that the Standardised Regression Weights of all the variables is more than 0.7 which indicates that each item of the construct is significantly representing the part of Social relevance of the working life. The Standardised Regression Weights represent the corelation between the measured variable and the construct. In the results it is found that the Standardised Beta of the variable “Matching of work life and social life” is the highest. This indicates that the most influencing variable of the construct Social relevance of the working life is matching of work life and social life which means that the handicraft units are aware of their social responsibility and they take care to match social and work obligations.
Table 33
|
Construct |
Variables |
Standardised Regression Weight |
Unstandardised Regression Weight |
CR |
P Value |
Multiple Correlation |
|
Social Relevance of Working Life |
Social responsibility of the organization |
0.776 |
1.000 |
|
|
60.2 |
|
Nature of job and social prestige |
0.641 |
0.882 |
12.617 |
000 |
41.1 |
|
|
Effect of job to improve social security |
0.788 |
1.080 |
16.131 |
000 |
62.0 |
|
|
Nature of organizational goals |
0.784 |
1.170 |
16.036 |
000 |
61.5 |
|
|
Matching of work life and social life |
0.816 |
1.093 |
16.841 |
000 |
66.6 |
|
|
Organization’s awareness of method of industrial pollution |
0.785 |
1.195 |
16.041 |
000 |
61.9 |
|
|
Price of goods and services from social point of view |
0.778 |
1.099 |
15.882 |
000 |
60.9 |
|
|
Importance to quality of products and services |
0.814 |
1.056 |
16.803 |
000 |
66.0 |
|
|
Contribution towards improving culture of the society |
0.797 |
1.065 |
16.354 |
000 |
63.4 |
The fitness of the construct is analysed with the help of Goodness of Fit indices as well as Badness of Fit Indices as shown in the Table 34. The Goodness of Fit Indices CFI (0.983), GFI (0.962), AGFI (0.937), and NFI (0.971) represent that the construct is statistically fit. Similarly the low values of Badness of Fit Indices represent the statistical fitness of the model.
Table 34
|
Goodness of Fit Indices |
Badness of Fit Indices |
|||||
|
CFI |
GFI |
AGFI |
NFI |
RMSEA |
LO 90 |
HI 90 |
|
0.983 |
0.962 |
0.937 |
0.971 |
0.060 |
0.040 |
0.080 |
The statistical analysis of the constructs and their variables prove that there exists validity and reliability and the variables are statistically fit for the study on quality of work life of the employees working in the handicraft sector in India.
References:
1. Agarwal. S. (2009). Growth of Handicrafts. CRAFTCIL, Monthly in- house journal of the Export Promotion Council for Handicrafts, Volume 4, Issue 2, P. 6.
2. Cascio, W.F., Manages Human Resource Productivity Quality of Work Life Profits. 5th Edition, McGraw-Hill, Boston 1998.
3. Chakraborthy, S.K. (1987). Will to do Yoga and Quality of Work Life Revisited. Vikalpa, Vol. 12. No. 3.
- EPCH, “Background note on definition of handicrafts’. Export Promotion Council for Handicrafts, Circular. Available at: <http://www.epch.in/circulars/circulars/definition.pdf>, Last viewed on August 18, 2011.
- Garg A.K. (2004), Management of Indian Organisations: A Study into its Quality Dimensions with reference to Handcrafted Artware and Giftware Industry, Ph.D. Thesis, Guru Govind Singh Indraprastha University, Delhi, p. 33
- Garg A.K. (2012). Managing Quality in Indian Handicraft Industry. New Delhi, Readworthy Publications.
- Garg, A. K., Dhingra, V. (November 2014). Newyork Science Journal. Employees’ perception about quality of work life: insight of handicraft sector. Retrieved from http://www.sciencepub.net/newyork
- George, N. D.(2011). Socio- Economic Condition of Handloom Workers in India, Yojana- A Development Monthly, Volume 55, 12-16.
- Ghosh A., Moradabad Exporters Smile Cautiously, The Times of India, New Delhi, Thursday, August 29, 2013
10. Goswami, B.N. (August 7, 2011). Art and craft metalware from South. The Tribune, Spectrum. Accessed on January 4, 2012
- Harris, L.C. (2002). The emotional labor of barristers: An exploration of emotional labor by status professionals. Journal of Management Studies, 39(4), 553–584.
12. http://dcmsme.gov.in/dips/DIP-%20Bidar.pdf, Retrieved, January 3, 2013
13. http://handicrafts.nic.in/state/rajasthan.htm, Retrieved, March 11, 2012
14. http://karnatakaindustry.gov.in/documents/Annual_Report.pdf, Retrieved, March 20, 2012
15. http://tradeportalofindia.com/contentmgmt/Desktops2.html?compid=itpo&itemcode=I334, July 14, 2013
16. http://www.ediindia.org/DSR/SNK-Cluster-Balakati.pdf, Retrieved, February 20, 2012
17. http://www.epch.in/moreDetails.htm, Retrieved, May 10, 2014
18. http://www.epch.in/policies/exportdata.pdf Retrieved August 22, 2014
19. http://www.india-exports.com/handicraft.html, Retrieved, July 13, 2013
20. Jabbar, A. (2011, February). A peek into the past with Mr. Abdul Jabbar- an industry veteran. CRAFTCIL Monthly in-house journal of the Export Promotion Council for Handicrafts, Volume 5, Issue 9, P.34.
- Jagadeesh Chandran G, Quality of work life in the industrial estates of Kerala, Ph.D. Thesis submitted in Mahatma Gandhi University, Kottayam
- Jain, S. (1991). Quality of Work Life. Deep and Deep Publications, New Delhi.
- Juran, J.M. (1992). Juran on Quality by Design. New Delhi, the Free Press Publications.
- Juran, J.M., Juran on Quality by Design, the Free Press Publications, New Delhi
25. Robbins, S. P. (1998), Organizational Behavior. (8th ed.). New Jersey: Simon & Schuster.
26. S. Buddhapriya, Work-Family Challenges and Their Impact on Career Decisions: A Study of Indian Women Professionals, Vikalpa, Volume 34, No. 1 January - March 2009.
27. Stronge, S. (1985). Bidri Ware: Inlaid Metalwork from India. London: Victoria and Albert Museum.
- Walton, R.E. Criteria for quality of work life, in Davis, L. E. et al. Quality of working life, projects and the state of the art. New York: Macmillian, 1975